Book Value vs. Market Value
When trying to assess the value of the equity of a company, there are two useful ways to think about it. As mentioned in the previous lesson, book value of equity is essentially the value of the company after all debt holders have been paid off. This can be calculated as:
- Book Value of Equity = Total Assets - Total Debt
- Note that many sources cite the right hand side as total assets minus total liabilities. However for our purposes, we consider equity a type of liability, so we label all other liabilities as debt. This just a matter of terminology.
However, this the type of information that a balance sheet gives us about a company’s assets and liabilities is only a snapshot in time, and does not reflect its past growth trends or future potential. While useful to know a company’s value if its assets were liquidated and then paid out, it does not portray an accurate picture of how all investors think about the company. The market, a conglomeration of investors all seeking to maximize investment returns, is a forward looking mechanism. It assigns value to stocks based on a company’s past results, current situation, and most importantly its future prospects.

If a company’s stock is worth $100 today, but all of a sudden there is news that the company’s industry will face harsh regulation in the future, investors will not be nonchalant and say if we liquidate the company today, this should be what we will get. Investors will discount future events back to the present, and the stock price will be taking this information about the future into consideration. The same can be said of a positive outlook. Investors will be less concerned about what the book value of equity is in a theoretical liquidation than what the company might earn in the future. After all, if we can buy a $100 stock today for what we think is worth $150 a year from now, we will probably be willing to pay more than $100 today for that potential return.
The degree to which the stock price reacts to events expected to influence the company in the future depends on how many investors agree with us. If we were the only ones who see the potential of a $150 stock, then we can probably purchase it for just a little above where it is currently trading. If most investors agreed with our outlook, it would increase demand for the stock to the point where it reaches an equilibrium near where the market thinks it should be trading. Having said all this, while book value is a great benchmark to assess equity value, the market value of equity of a company reflects what investors are actually thinking.
Enterprise Value vs. Equity Value
We as investors are often concerned with valuing a company’s stock. But before continuing to discuss valuing its equity portion, we must mention a concept called enterprise value, or EV, that gives a broader picture of what exactly is a company worth. An investor into a company’s stock, its equity, is mainly concerned with valuing that portion of the company. However, in the very dynamic world of finance where companies and private equity firms buyout other companies, often times they buy the entire company - not just the equity portion. In this type of situation, the acquiring company or PE firm will be looking to buy the entire company - both its debt and its equity. To assess the value that it should assign the company to be bought, investors often use its enterprise value, as defined by the following equation, which we will write in two forms:
- Enterprise Value = Equity Market Value + Debt - Cash
- Enterprise Value + Cash = Equity Market Value + Debt
Here, we should note two things. We use market value instead of book value because buyers can’t buy stock at the price in a theoretical liquidation scenario. They must pay the actual price at which investors are willing to sell the stock in the market. Second, we do not count cash as part of a company’s enterprise value. When we purchase a company, it probably holds some cash as part of its assets. However, part of the price we pay is for the cash itself, not the underlying value of the company. So after we have control of the company, we have control of its cash as well, which effectively lowers the price we paid. We pay to take control its equity and debt. We get in return the enterprise value and cash. To put it another way, imagine that we go to a car dealership and see a car with a pile of cash on its seat worth $10,000. The price tag is $30,000. But are we really paying $30,000 for the car? No, we are paying the $30,000 in total - $20,000 for the car itself and $10,000 cash. It might seem like a weird concept to pay cash for cash, but nevertheless, that cash is part of the company. We have to purchase the whole package, but our effective purchase price is the enterprise value.
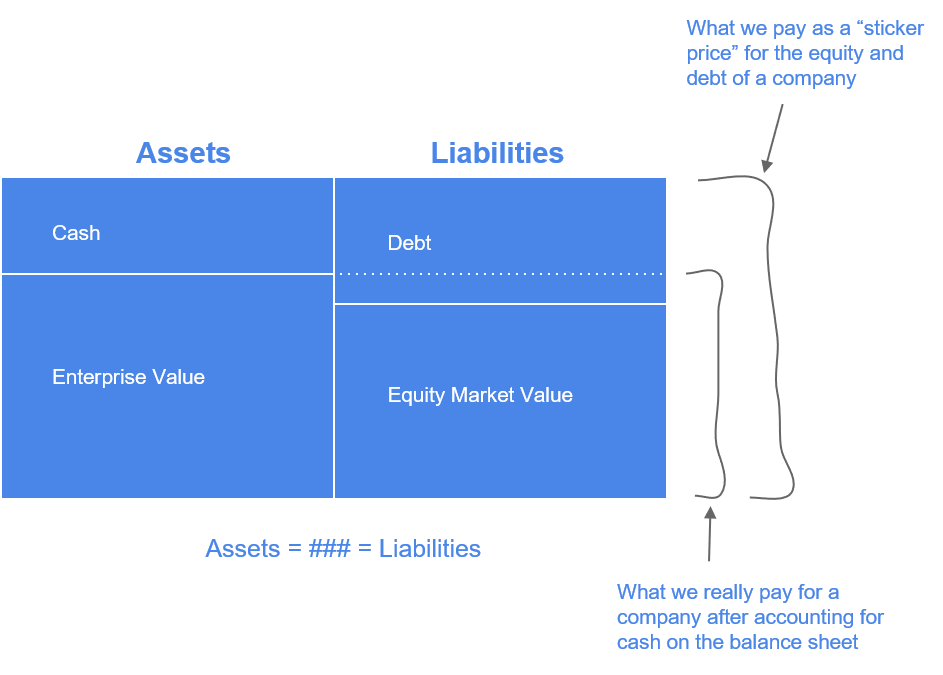
The concept of enterprise value is important when considering the value of a company through its entire capital structure, both debt and equity. However, as investors who want to profit from buying stocks, we are most concerned with the equity value. Although both are important concepts to understand, they are useful in different situations for different market participants. For most of our lessons, we will focus on the equity portion of a company.
DCF
There are two popular ways to value the equity of a company. One is called discounted cash flow, or DCF. It discounts future cash flows to a present value and then adds them up to get the value of the entity generating the cash flows. The second is called comparables analysis, or comps for shot. Instead of looking at a company and working out the details of cash flows, it relies on the values that the market already assigns other companies, and uses various valuation metrics to compare the company of interest to its competitors in its industry, or to the broader market. On this page, we will focus on DCF, and on the next page, we will focus on comparables analysis.
Time Value of Money
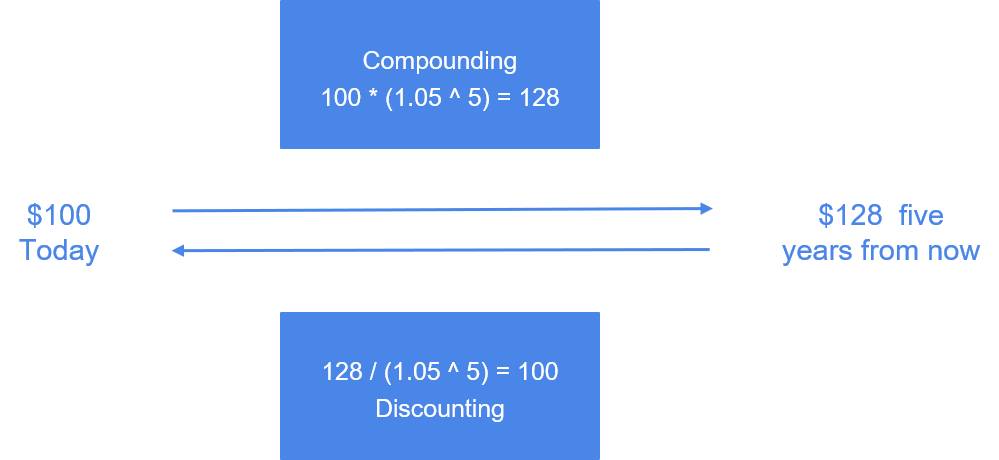
The method of discounting cash flows goes back to the concept of the time value of money. If needed, we suggest taking a look at the lesson interest rates for a more complete discussion. Money, as we know, flows in and out of a business over time. The net amount of cash inflows, after subtracting outflows, is collected by the company year after year. However, money received 5 years from now is not worth the same as money received immediately. As a result, a general pattern in finance is that money received sooner is worth more than money received later. How do we know how much is the difference in value of cash flows over time? If we think about starting from the present and ending in the future, the concept is compounding of money. A $100 investment compounded at 5% annually over five years is worth $128 five years from now. In contrast, $128 received five years from now is only worth $100 today, assuming the same 5% discount rate. Therefore, when we calculate the future cash flows of a company in order to value it today, we have to add up the present value of the future cash flows, not the raw dollar amount.
Constant Cash Flow Example
We will start with a simplified example. Let’s imagine that a company with no debt will be generating $1000 of free cash flow per year for 5 years. After the 5 years, the company decides to close down, so we have a clean, even set of 5 equal cash flows over a period of time. We will assume a 5% discount rate. If we look at the cash flow from the end of the first year, that $1000 is worth $1000 / 1.05 = $952 today. The $1000 cash flow from the end of the second year is worth $1000 / 1.05 / 1.05 = $907 today. We do this for years 3, 4, and 5 as well, then add the present values of the future cash flows together to arrive at a net present value of about $4330. Contrast this with the value we would get if we received all the cash flows at once and immediately - $5000. The difference represents the time value of money that we lose the longer we wait to receive the cash flows.

Adjustments for Reality
Of course in real life, the cash flows of a company will not be so simple, so we will need to make some adjustments. First of all, most companies do not only operate for 5 years. Because it would be too cumbersome to put out cash flow numbers into eternity, there is a terminal calculation to just lump all the cash flows after 5 years into one number. There are two ways to get to this terminal value.
Growth in Perpetuity
If we assume that for all years after year 5, our cash flows will remain the same, then the sum of those can be calculated by the equation:

We will not get into the mathematical derivation of how this equation works, but it can be easily found online by googling “sum of geometric series”. Using our example company to calculate the terminal value for period 6 and beyond, the equation is:

However, if our company does well, then we multiply our FCF numerator by a compounding value (1+g) representing the growth rate of FCF:

Again, we will not get into the mathematical derivation, which can be found online. Using our example company and assuming an annual growth rate of 2% in perpetuity, the equation is:

Discounting this 6th year terminal value to the present is dividing 34,000 by 1.05^6, which yields us a NPV of 25,373. And summing up our company example we have:
- NPV of first 5 years of $4330
- NPV of 6th year Terminal Value of $25,373
- Total equity NPV of $29,703
- Divide by number of shares outstanding to get price per share of the stock. If we had 1,000 shares outstanding, each share would be $29.70.
Note that that in this case, we are calculating the NPV of a company that is all equity and no debt. To calculate the equity portion using DCF when there is debt, we would use levered free cash flow, which is FCF after paying interest expense on debt. To calculate the entire enterprise value using DCF when there is debt, we would use unlevered free cash flow, which is FCF before the impact of interest on debt. Also note that when calculating a discount rate, a common method is to use weighted average cost of capital, or WACC, which we will not discuss here but encourage you to explore online.
Terminal Multiple
The other way to calculate terminal value would be use the appropriate market multiple * terminal FCF to get terminal value. This can vary depending on whether we are calculating for equity or enterprise value. Let’s assume we use the multiple method calculating enterprise value. We would use a commonly used multiple like EV/EBITDA, multiply it by the terminal period EBITDA to get terminal value, discount it back to get NPV of terminal value. Then, as we did above, we add NPV of terminal value to NPV of projected unlevered cash flows for first few years, to get current enterprise value (for a company with debt). Subtract net debt to get implied equity value, and then divide by number of shares outstanding to get price per share of the stock.
Valuation Metrics
Before we discuss comparables, it is important to explore a few important valuation metrics that investors across the industry use. These metrics help us better conceptualize the relationship between the price we pay and what we get in return.
P/E
A widely used ratio is the P/E, or Price to Earnings ratio. It is the relationship between the price that we pay for a stock to the earnings that equity investors are entitled to. It can be calculated in two ways:
- Price per share / Earnings per share
- Equity Market Value / Net Income
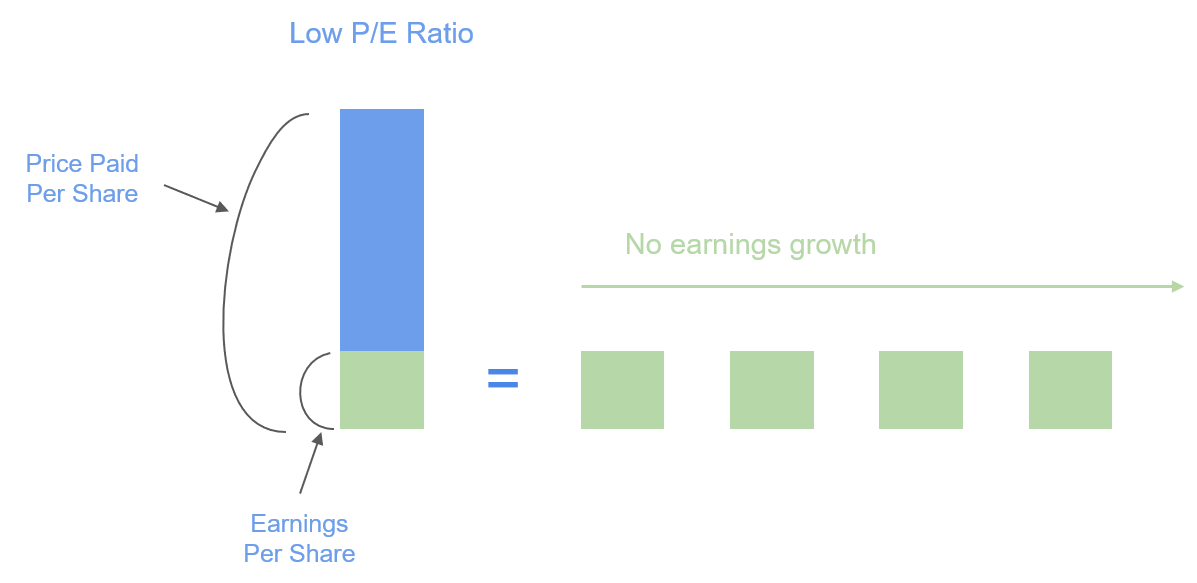
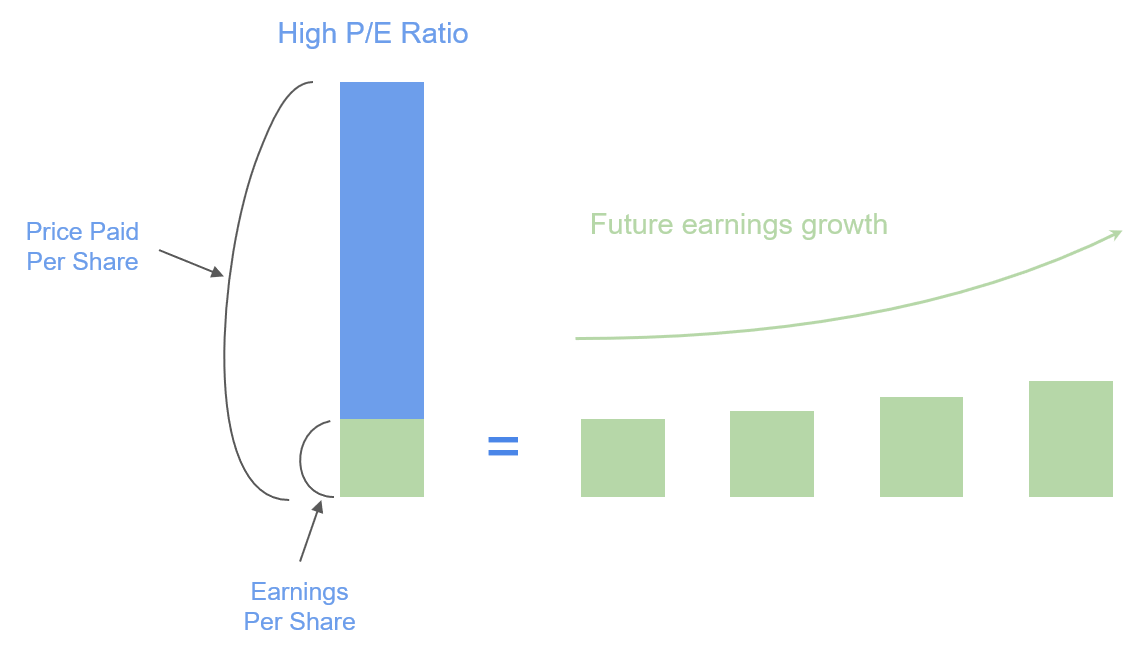
Both ways are equivalent, but the first calculates on a per share basis while the second calculates P/E from the perspective of the entire company. It is an easy, intuitive way to think about a company - the price that we pay for a company divided by the earnings that we are entitled to in return. High P/Es signal that a stock is expensive because either earnings or low or the price we paid is high. The opposite is true for low P/Es. However, this is not such a clear cut divide - P/E ratios vary across industries due to the nature of the industries and companies involved. However, a general rule of thumb is that high P/E ratios imply expectations of higher growth rates in the future. This is the case because investors are willing to pay a higher price today in anticipation that the earnings with grow in the future. Usually higher growth and early stage companies have high P/E ratios while mature, stable, and low growth companies have low P/E ratios. However, the P/E ratio is just a measure of market consensus, and it is up to us as investors to determine whether we think companies are overvalued or undervalued.
EV/EBITDA
Another widely used metric is EV to EBITDA. Enterprise Value represents the non-cash value of a business as described earlier in this lesson. EBITDA stands for earnings before interest, taxes, depreciation, and amortization. This is a good representation of the operating income of the business as a whole including equity and debt and not considering accounting measures like tax rates, depreciation, and amortization. It is often used by private equity firms and companies looking to acquire other companies to value the whole firm that they are getting.
Other
Numerous other ratios will pop up, and each is better suited to different types of situations. Other metrics include price/sales, price/book value, book value per share, earnings per share, debt to equity ratio, price to earnings growth ratio, etc.
Comparables
To value a company, one way to go about it is to start from scratch and do a DCF. Although we can make different assumptions about growth rates and discount rates to give a range of estimates for the fair value of a stock, there is a wealth of information that is left out in a DCF analysis - the market’s assessment. The market gives us much information in terms of its consensus on other companies, the industry, and the entire market. While DCF is great for understanding how to value assets at a fundamental level and is applicable to many assets besides equity, it is very calculation intensive. Research analysts in the industry run DCF models for their equity research reports, and still, their models are constantly updated and have handy caps related to the assumptions that they use. For the average investor, a strategy of using comparables is a bit more practical and efficient use of time. If we have the time and dedication to make our own models, we would, but when many research reports already have pre-built models available to the public, it is probably more practical to combine the two approaches. As the saying goes, don’t reinvent the wheel.
When doing comps analysis, the basic idea is to compare to other companies, industry averages, and the broader market. Imagine that we are interesting in investing in bank stocks, and we notice the below chart.
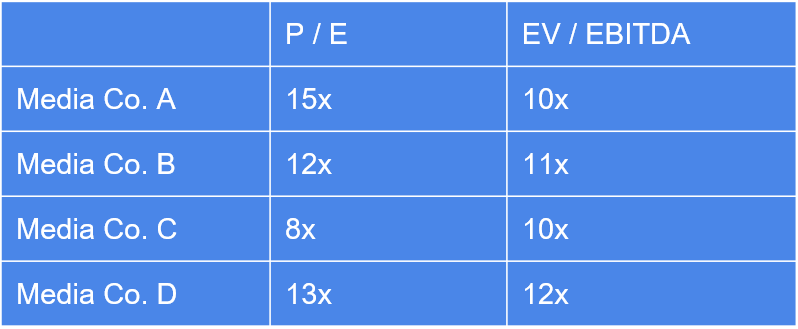
We take a look at the table and see that hypothetical media company C has an EV/EBITDA ratio a little below the industry average, but a P/E ratio far below the industry average. Why might this be? We as investors take on the burden of doing the research about a company to determine whether a company’s seemingly depressed stock price is accurately assessed by the market or mispriced. If every aspect checks out about the stock, and it seems to be a great company trading a cheap P/E ratio, maybe it is an investment opportunity.
Review
This lesson provided a summary of the basic methodology of equity valuation. The two main ways to value stocks are through DCF and comps analysis. While doing these analyses, keep in mind the capital structure and type of company in question. Comps are great for looking at companies within industries, but not as helpful comparing a tech company to an industrials company. DCF is great for modeling out cash flows to assign a value to an asset, but by itself does not paint a full picture of a company’s prospects. We also need to be careful in how we do the DCF - whether we are incorporating debt or not in our FCF calculations. While these methods are established practices in the finance industry, sometimes the market doesn’t seem to agree at all with the valuation. In the next lesson, we discuss technical analysis, and how this can complement our valuation techniques when trying to make an investment decision.