Income Statement
In our previous lesson, we illustrated the concept of a company through the example Sally’s Smoothies. The company did pretty well in growing in just a few weeks from humble beginnings to a few thousand dollar valuation. However, to better illustrate how many companies function today, let’s pretend that it’s 5 years later and Sally has expanded her smoothie stands into a full fledged local business with several branch locations.
Let’s make a few assumptions to set up the situation we want to work with. Sally, 5 years later, now has 4 branch locations with 2 employees each. Her friends do not work the stands anymore, but help her with business administration roles. Let’s start by thinking about the income statement. So what is it exactly? As its name suggests, it is a statement of a business’ income, or how much it earns over a given period. Let’s calculate a hypothetical annual income statement.
Revenue
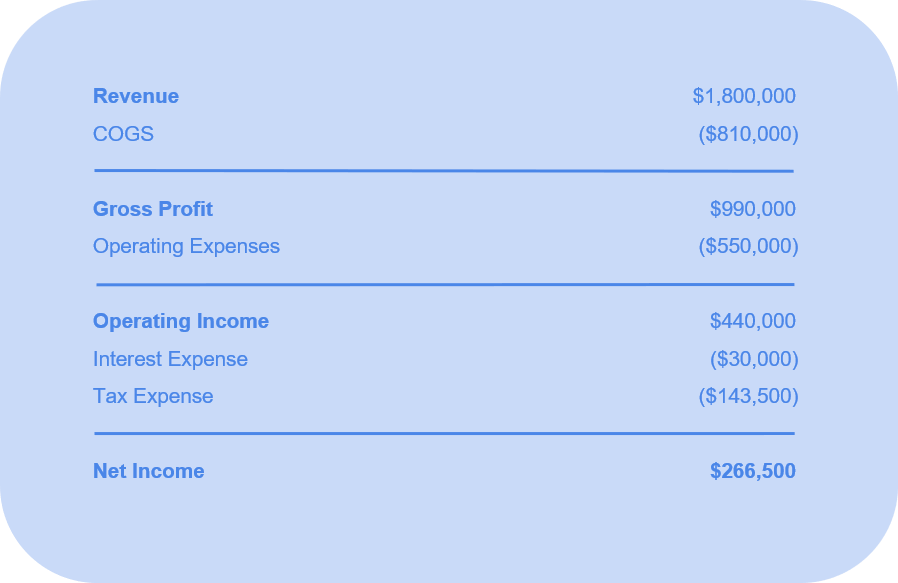
A business reports its earnings, but it takes several steps before a company actually gets those earnings. We will start with the top line, or revenue. Revenue (sales) is the primary inflow of money for a business. When we think about how much a business earns, it first has to sell a product or service. Sally’s Smoothies locations are open for 10 hours a day. On average for each branch, 25 smoothies are sold per hour, which amounts to 250 smoothies a day. If Sally prices her smoothies at $6 each, and runs the stores for 300 days out of the year, then 250 smoothies * 300 days * 4 branches = 300,000 smoothies per year. Then, $6 * 300,000 smoothies = $1.8 million in revenue per year.
Cost of Goods Sold
The next line on an income statement is cost of goods sold, or COGS. This is the material cost of the physical products or services sold, so in this case, it would be the cost of materials to make smoothies. When Sally was operating on a small scale, her smoothies cost about $3 to make. However, when she scales up in size, she can afford to purchase in bulk, which is usually cheaper than smaller purchases. Let’s assuming that instead of $3 per smoothie, it will cost her $2.70 instead. $2.70 * 300,000 smoothies = $0.81 million per year.
Gross Profit
At this time, we can calculate a metric called gross profit or mathematically:
- Gross Profit = Revenue - Cost of Goods Sold
In this case, it would be $0.99 million per year.

Operating Expenses
As much as Sally would like to, she can’t just magically churn out smoothies from thin air. In order for her company to stay up and running, it incurs operating expenses like rent, employee salaries, utility, administrative, advertising, etc. Let’s assume that rent, employee salaries, and advertising are her largest operating expenses. A rent of $5000 per month * 12 months * 4 stores = $0.24 million. She has 4 branches, each with 2 employees working at all times for $12 an hour. $12 * 10 hours per day * 300 days * 8 employees = $0.29 million. Let’s assume that she spends $20,000 per year on advertising. Summing up rent, salaries, and advertising, we get $0.55 million in operating expenses.
These operating expenses are sometimes also called SG&A, or Selling, General, and Administrative expenses. Some other types of operating expenses can include R&D, or research and development. However, let’s just assume that Sally’s product is tried and true, and she doesn’t need to extensively research and develop more smoothie recipes.
Another category of expense that is sometimes grouped in this section is depreciation and amortization. Companies invest in assets like equipment and machinery that have a cost upfront, but lose their value over a time as they degrade and are used. To reflect this as a cost in each reporting period to decrease a company’s taxable income (so it can pay less taxes), it is allowed to deduct this cost as depreciation. Amortization is the same concept but applied to intangible assets like copyrights, patents, etc. In this case, we will pretend Sally does not have any costs in this category.

Operating Income
Of the various measures of profitability, operating income is one of the most important. It measures the organic health of a company’s business since it is directly related to the daily performance of the company, as opposed to non-operations related costs that will be mentioned later on like interest expense and taxes. Sometimes, this is also called EBIT, or earnings before interest and taxes. The equation to calculate it is:
- Operating Income = Revenue - COGS - Operating Expenses
In this case, it would be $0.44 million per year. A measure of how cost effective a business is, is called operating margin. It is the percentage of revenue that a company actually gets as earnings It is calculated as:
- Operating Margin = Operating Income / Revenue
In this case, it would be 24.44%.
Interest and Taxes
Non-operational expenses include interest payments on debt, and taxes. Let’s assume that Sally’s company has $0.50 million dollars of debt outstanding over a 5 year period paying 6% interest per year. 6% * $0.50 million is $.03 million. This leaves $0.41 million of income before taxes. Let’s assume that Sally pays a combined 35% tax rate on federal, state, and local taxes. 35% * $0.41 million = $143500 in taxes.

Net Income
We have finally arrived at the bottom line of the income statement, the figure representing net income. This is essentially the “take home earnings” of a company after all types of expenses and costs. Net income is calculated by the equation:
- Net Income = Revenue - COGS - Operating Expenses - Interest - Tax
In this case, Sally’s Smoothies’ net income is $266,500 or around $0.27 million. Congrats on making it the finish line!
Cash Flow Statement
An income statement is a great way to look at the earnings performance of a company over a time frame, but it is not the whole picture. When we earn a salary as individuals, our personal finances are pretty straight-forward. We get paid in cash mostly, and after we work for a period like 2 weeks, we can expect to get paid immediately at the end of two weeks. However, the accounting statements of companies are a bit more complicated. Sally’s Smoothies is a pretty straightforward company as far as accounting goes, so it would not be a great example to use for a cash flow statement, so we will use other examples.
Take for example a company that earns its income from contracts with other companies or governments. The company knows it will generate revenue because it is in a contract with a buyer of its services, but it doesn’t actually receive the cash until a later date. Many companies report earnings, but due to a variety of factors like tax, timing of cash flows, depreciation, investments, and financing, the actual cash received or might differ a little or a lot from reported earnings. This is why variations in accounting practices may drastically change the picture of a company’s financial health. It might be reporting good earnings on paper, but not generating a lot of cash. This is why there’s a saying in finance cash is king. Below is a template for a cash flow statement.
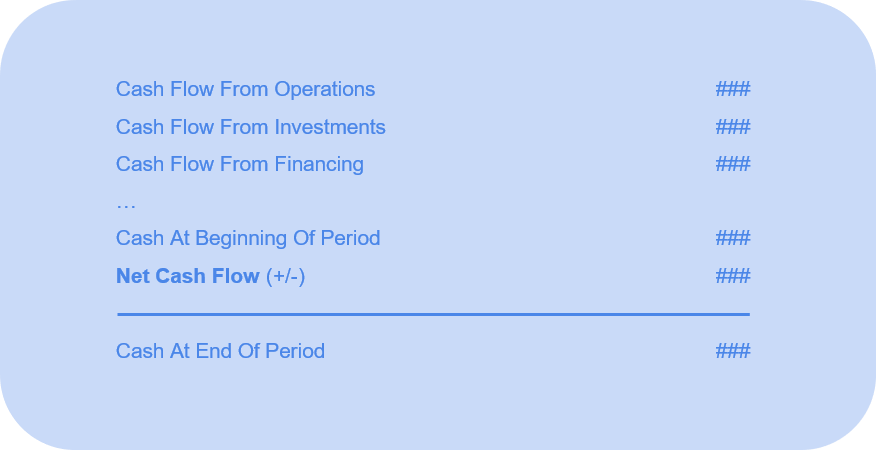
The cash flow statement picks up where the income statement ends - at net income. Net income is the reported earnings of a company, and we modify these “baseline earnings” by making some adjustments. The adjustments that we need to make to arrive to Net Cash Flows can be divided into 3 categories:
- Cash Flows from Operations
- Cash Flows from Investments
- Cash Flows from Financing
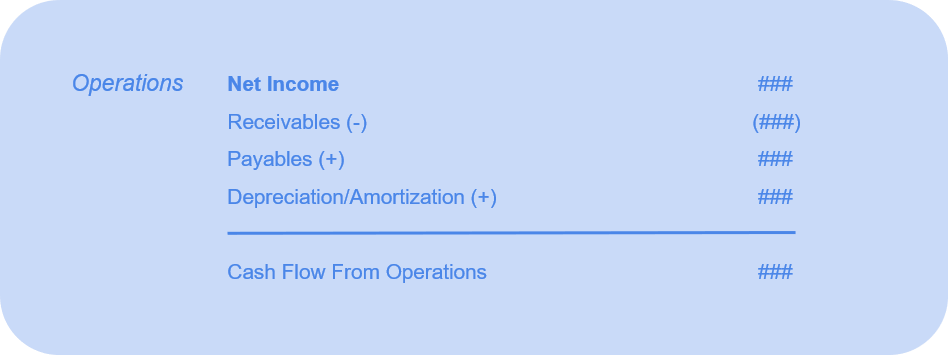
We will start by discussing some of the adjustments in cash flows from operations: receivables, payables, depreciation.
Receivables
Let’s imagine the government signs a contract with an aerospace defense company to buy some military aircraft for. The contract is for $50 million to be paid out over a time frame that spans across 2 reporting periods for the company.
This “revenue” can be considered as a receivable because the company counts the revenue in the current reporting period because it’s considered one transaction, but doesn’t actually get the cash all up front. It receives the cash over a period of time. When calculating cash flows, receivables are subtracted from net income because the company didn’t actually receive the cash yet. Using our aerospace company, let’s imagine that it gets its half of its contract payments in period 1 and the other half in period 2. Reporting cash flows for period 1, it would subtract $25 million in receivables from net income because it didn’t receive $50 million in cash, only $25 million.
Payables
The opposite is done for payables. These are transactions counted as expenses because the company might have agreed to pay for some services, but hasn’t actually paid out the cash yet. Payables would then be added back in the cash flow statement since it has a positive impact on cash flow (paying out less in cash in a period than is reported in earnings). The aerospace company might have received some consulting advice on how to smooth out their operations, but has not paid its consultants yet. It bills this expense in the period the “transaction” takes place, but the cash might be paid out later. Because it subtracted the consulting expense in the income statement, it would add it back in the cash flows statement.
Depreciation
When an asset is depreciated, the “cost” is subtracted from income, but since it an accounting practice and not a cash expenditure, it doesn’t affect cash flows. This is why when we start from net income at the top of the cash flow statement, depreciation is added back to reflect that the expense reported on the income statement is not a cash expense. For example, the aerospace company might have purchased a lot of equipment for a new factory in the previous period. To represent the cost of wear and tear on the equipment over time, the company subtracts the depreciated amount - let’s say 10% of the purchase value - in the income statement. However, since the equipment was already paid for in cash in the previous period, there is no actual cash expense in this period, so the depreciation is added back in the cash flow statement.
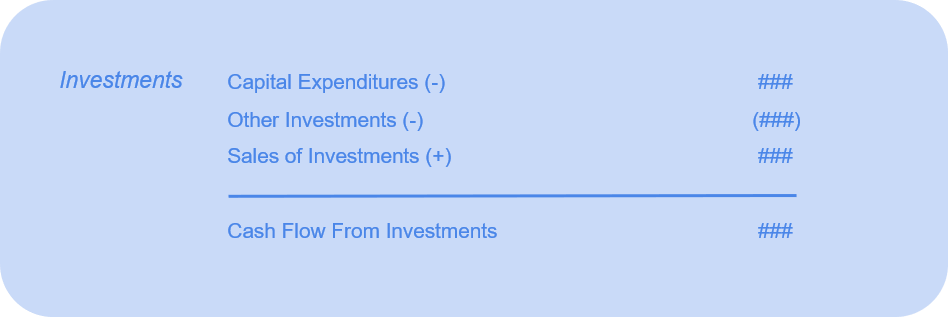
Next we will discuss cash flows from investing. These can be investments in publicly traded securities, investments in real estate, or investment in equipment/tools. Here, we will primarily discuss investments in real estate and equipment/tools, which is often categorized as capex or capital expenditures. This capex can also be described as investments in PPE, or property, plant, and equipment.
Capex
Capex is calculated as the net change in PPE values over a given period. The equation is:
- Capex = PPE in current period - PPE in previous period + depreciation
Note that we add depreciation back into the measure. If we spend nothing and capex = 0, and do not add back depreciation, we would see that current PPE < previous PPE since these physical assets lose value over time. But if capex = 0, current - previous is less than 0, we have to add the depreciation back so that the equation balances.
Capex has a negative impact on cash flow because it is not part of the income statement, and therefore, it is a cash expense not reported in net income. This happens because the income statement is supposed to reflect the finances of ongoing operations, not one-time expenses. Nevertheless, we are paying out cash for those assets. This decreases our cash flow, so we should subtract capex. Note that if we sell more in PPE than we buy, then capex is negative, meaning it has a positive impact on cash flows. This makes if we are receiving more proceeds from sales than what we spend.

The last category of cash flows is from financing. If we raise cash from issuing debt or issuing equity, then our cash flows increase. The debt and equity we sold brought us in more cash for the company. This is in exchange for future interest+principal owed to debt holders and ownership owed to equity holders. Sales of equity and debt bring in cash, has a positive impact on cash flows, so they are added. Repayment of debt and repurchase of equity are cash expenses, has a negative impact on cash flows, so they are subtracted.
Balance Sheet
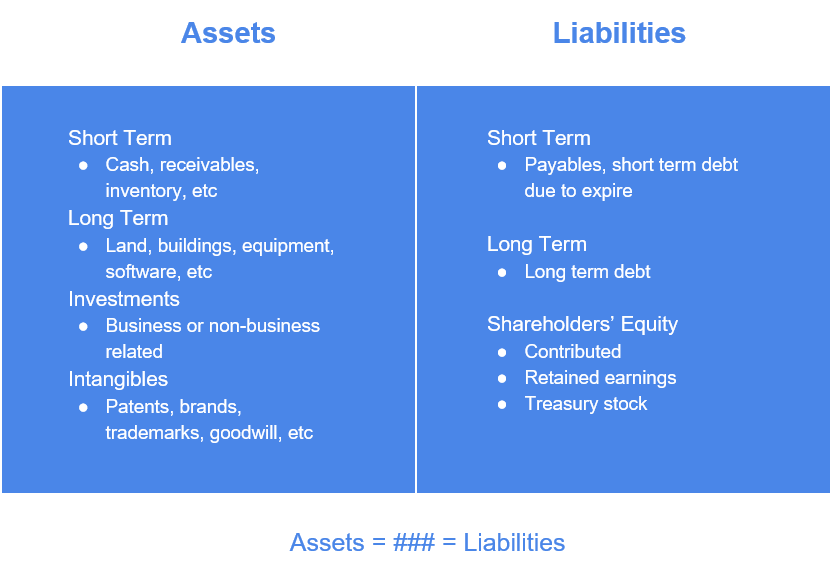
Lastly, we will take a look at the balance sheet statement. In the previous lesson, we gave several snapshots of what a simple balance sheet looks like for Sally’s Smoothies. However, in a mature company with complex operations, it is rare to have such a simple balance sheet. Below, we will discuss various parts of the balance sheet, categorized by assets vs. liabilities, and short term vs. long term. Note that it is common to describe shareholders’ equity as separate from other liabilities. However, for educational purposes, we will consider it as within the liabilities side of the balance sheet. This is because it is technically an obligation the company has towards its shareholders and a source of financing for its assets.
Assets
Short Term - A company’s short term assets are things like cash, accounts receivables, inventory, etc. These are all potential sources of future revenue. They are short term because they come and go as part of operations and are not part of any long term planning.
Long Term - A company’s long term assets are things like land, buildings, equipment, software, etc. These are also potential sources of future revenue. They are long term because they do not change with day to day operations, but help the company create value through many cycles and reporting periods. They often stay as assets for as long as they are useful.
Investments - For our purposes, they refer to investments that are not involved with the day to day operations of a business. For an aerospace company, we would not count an investment into a factory that is important to operations - it can’t build any aircraft without a place to build things. We would count investments in other companies that are more or less unrelated to the original company’s operations. For example, if an industrial company just happened to have a lot of cash on hand and decides to use it to buy part of a software company, it would be a non-operations related investment. Some companies that generate enough cash use the extra funds to earn a return through various types of investments.
Intangibles - Assets that have no obvious for-sale value or physical value can be described as intangible. Examples may include copyrights, patents, brands, trademarks, goodwill, etc.
Liabilities
Short Term - Liabilities that are short term are obligations the company needs to fulfill. Examples payables are goods or services already received but need to be paid for in the near future. Short term debt is also owed to debt holders in the near future.
Long Term - Liabilities that do not impact the day to day cash flows of a business include long term bonds. For example, a company with a 20 year bond outstanding does not have to worry about paying that off on a day to day business. Instead, it should make financially sound plans to expand and sustain the business so it can pay them off when the time comes.
Shareholders' Equity - The previous types of liabilities we have discussed are obligations to debt holder. Equity, on the other hand, is an obligation to the company’s owners. Shareholder’s equity has several sub-components, but to generalize, it represents the value of the company after debt holders have been paid back. Imagine if a company had no debt - then shareholders would control 100% of the assets.
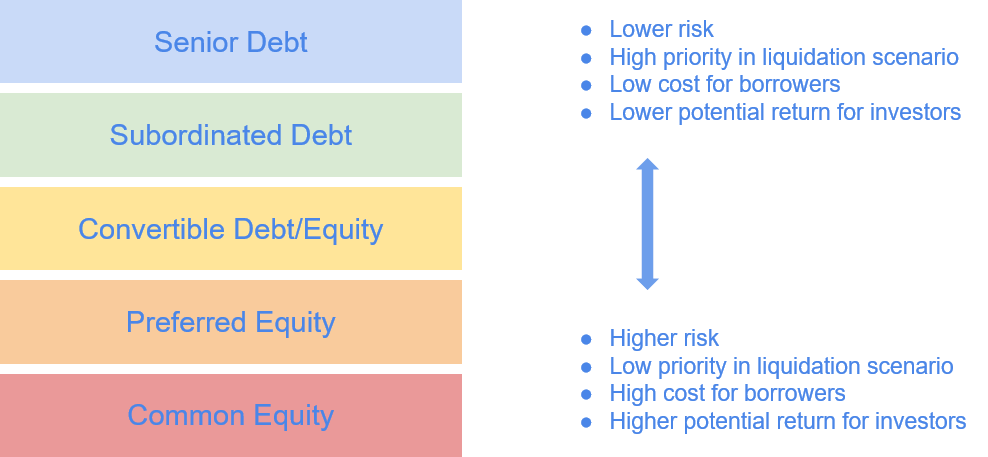
At this point, we have talked about equity from the perspective of an idea called book value. This is a term that describes the value a company’s equity shareholders would receive if it were to be liquidated immediately. For example, from the last lesson, Sally’s Smoothies had total assets of $2700. If the company were to shut down and payout its debt and equity holders, it would have to first sell its assets. It had $2360 in cash, and $340 in equipment. Normally, the resale price of used equipment would be lower than brand new equipment, but we will assume for now that it can be resold at initial purchase price. $550 would be paid out to Sally’s parents including interest, leaving $2150, representing the equity book value of the company. Note that in this case, there was enough money to distribute to everyone. However, if a company is doing badly and the sale of its assets do not generate much cash, then debt holders will be paid out before equity holders because debt has priority in the capital structure over equity. What we mean is that a company borrows money promising to pay that money back, but a company’s obligation to equity holders is everything that’s left after debt is paid back. For this reason, equity is more risky because owners take on the risk of the business, but are compensated by higher potential returns if the business does well.
Review
Now that was a lot of technical knowledge! After this lesson, if all went smoothly, we should have a more comprehensive understanding of how to think about a company. Income Statements describe the earnings of a company over a period of time. Cash Flow Statements describe the actual inflows and outflows of cash of a company. Balance Sheet Statements describe a snapshot of the composition of a company’s assets and liabilities. Now that we have a more robust set of tools to work with, in the next lesson, we will use this knowledge to value the equity portion of companies - specifically from a market value perspective instead of book value.