Tulip Mania
Although not necessarily the most momentous period of economic history, we shall start our lesson with the Dutch Tulip Mania of the 17th century. Knowing stock market history isn’t a promise to be able to predict the future, but is undoubtedly of use in making sense of current events. After all as Mark Twain supposedly said, “History never repeats itself, but it often rhymes.”

In the Dutch Golden Age in the 17th century, there was a period of time of speculation that resulted in one of the earliest recorded “bubbles” of investing history. Tulips are flowers of vibrant, intense colors, which at the time in Europe were of great interest. Tulip trade started before the bubble, but as their popularity grew, people started bidding up the flower’s price. As with any speculative bubble, the enthusiasm can reach a fever pitch. At its peak, some wealthy collectors paid for certain tulip breeds with land and houses! Of course in time, the flower’s price collapsed back to its fair value, and the people who put so much of their wealth into tulips learned a lesson they would never forget. While today’s financial markets are much different, human psychology hasn’t changed a whole lot. We hope that you really appreciate the next tulip that you come across.
Great Depression
One of the most challenging periods in the 20th century was the onset of the Great Depression. It affected countries around the world and lasted for several years, leading economists and politicians to seriously revise their way of thinking about the world. It propelled the creation of impactful legislation in the U.S. like the New Deal, and created the type of environment that fostered the growth of radical groups like the National Socialist Party in Germany.
The Crash and Stock Market
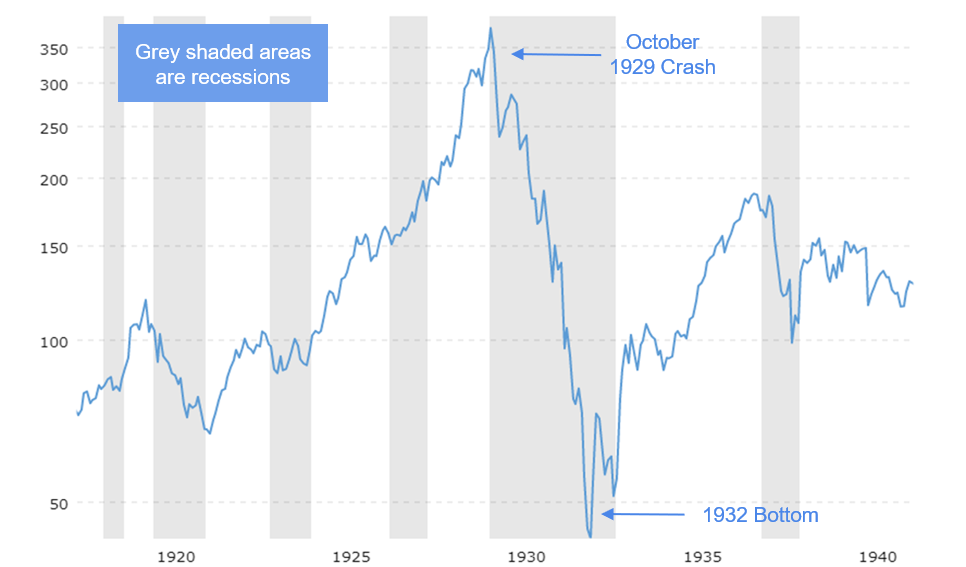
After several years of a surging economy and enthusiastic consumerism, the Great Depression began as the U.S. stock market crashed in October, 1929. From a peak of around 380 in 1929, the Dow Jones Industrial Average dropped almost 90% in value to reach a bottom of 43 in 1932. It didn’t regain its peak until about 25 years later in 1954. Of course these numbers may seem dramatic, but we need to keep in mind that at the time, markets were less regulated than they are today. In a sense, it was the wild west of capitalism where the booms were booming and the busts were total busts. Market cycles were extreme, and fortunes were made and lost. For a more in depth discussion of its causes, please refer to the lesson History under Finance Fundamentals.
Financial Reform
While there were many important social and regulatory reforms, we shall focus mostly on reforms as they relate to investors. The Securities Act of 1933 and the Securities Exchange Act of 1934 were two main pieces of legislation passed by Congress to establish limits to the amount of risk taking allowed for both financial institutions and investors alike.
- Financial Institutions
- Separation of investment and commercial banking activities helped insure that the money of low risk depositors is not used for riskier investment bets and lending.
- Imposition of margin requirements prevented financial institutions from lending out too much money to investors who wanted to make risky bets. Buying on margin is the practice of using borrowed money to buy or short stocks.
- Establishment of FDIC insured depositors their bank account funds up to a certain amount.
- Legislation requiring more detailed and transparent disclosure about the types of securities sold to investors.
- Investors
- Imposition of margin requirements prevented investors from taking more risk than they are able to handle in case things don’t go their way.
Price Return vs. Total Return
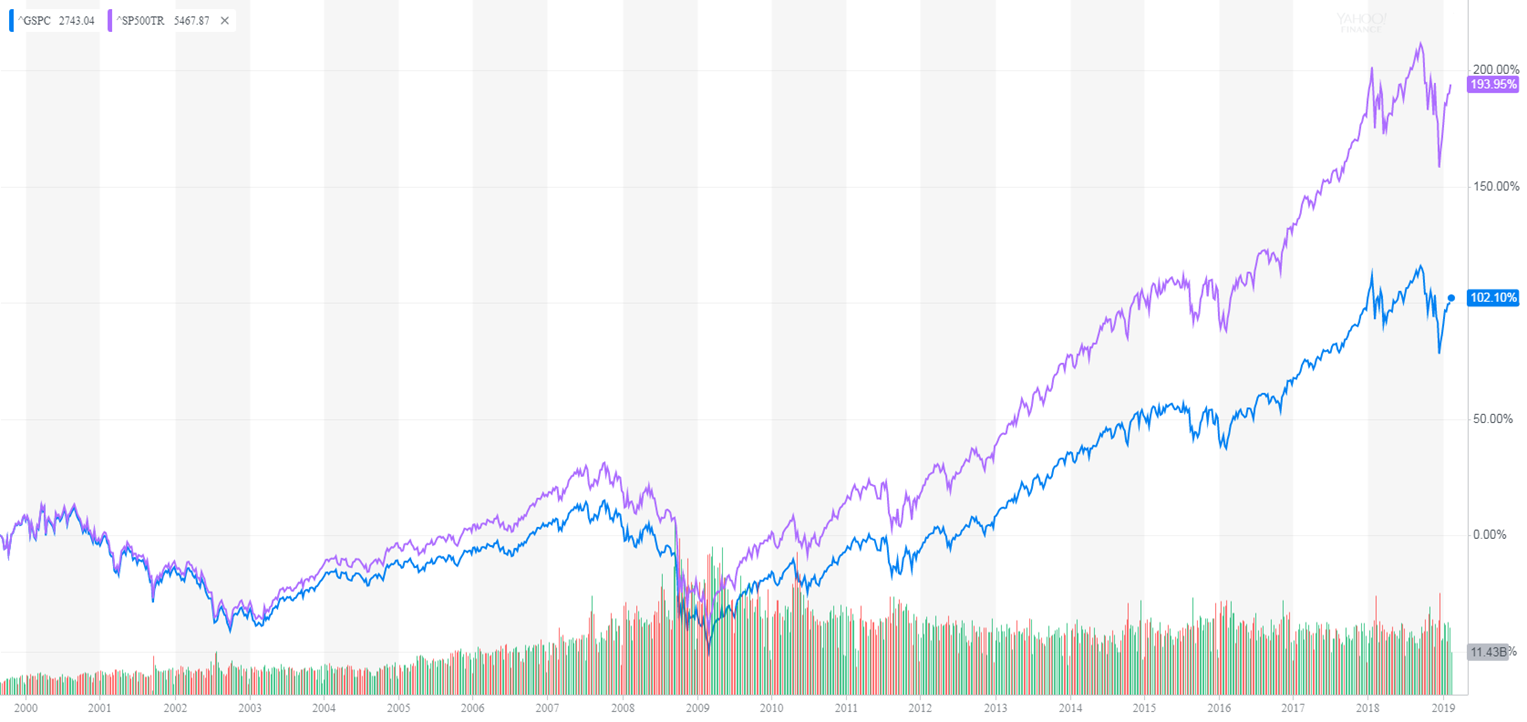
Note that for most of the rest of the lesson, we will be using the DJIA as our benchmark index for historical references. This is a reasonable reflection of the performance of the general market for historical purposes. Another popular benchmark is the S&P 500 index, and both have comparable returns. However, it is important to note that in our assessments of stock market returns, they are based on price-return indices. That is, the indices do not take into account that companies pay out dividends, and only consider the stock prices. If we reinvested dividends like in a total return index, the stock market returns for all our calculations would be even higher! For example, below is a graph from yahoo finance comparing the S&P 500 index and the S&P 500 total return index over approximately 20 years. We see that returns would almost be double if dividends were continually reinvested - the magic of compounding!
World War II
In an era of chaos and fear, it would make sense to think that the stock market would perform poorly. When the world is falling apart, as it almost seemed to during the darkest days of 1941 and 1942, we might be afraid to invest in the stock market. However, history has shown us that wars are not necessarily a bad time to invest. As an old English saying goes, it is darkest before dawn. Take for example World War II, the deadliest war in human history.
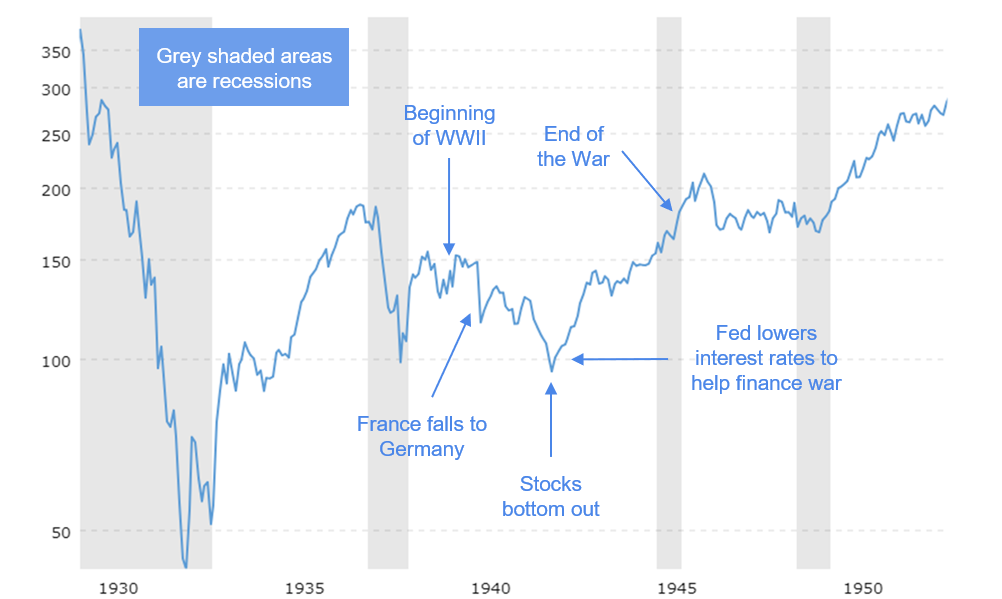
At the outset of war in September 1939, the DJIA was at about 140. Germany toppled France, and the market took a beating. Pearl Harbor was bombed, and stocks dropped even further. The United States had been forced to join the war, and the allies were on the brink of defeat in late 1941 through 1942. It turns out that without any major Allied victory, April 1942 was actually the bottom of the market at around 95, after which stocks almost doubled to around 180 by the war’s end and tripled by 1952. 1942 was a great year to buy stocks. This shows that the market in its fickleness may all of a sudden decide enough is enough. There were no major positive military developments in early 1942 for the Allies.
What probably did help, though, was the Federal Reserve deciding to help finance the war by keeping interest rates low - a change in the economic environment. Oftentimes, waiting for specific events to turn things around is guesswork. The only sure thing is knowing that a company that sells candy in the American midwest is not going to be fatally impacted by the battle of Stalingrad in the Soviet Union. In fact, soldiers probably could have enjoyed some sweets. If we had waited all the way until 1943 or 1944 when the currents of war seemed to turn for the better, we would have missed out on approximately a 40% rally to 140.
Stagflation 70s
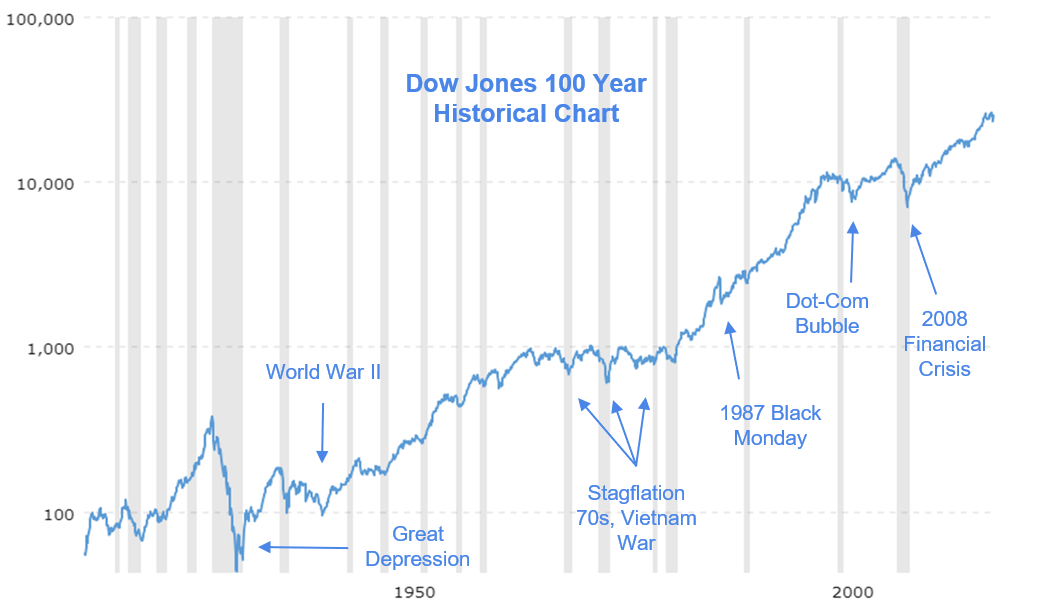
After the postwar optimism of the 50s had faded, by the late 60s and 70s, a challenging economic environment for stocks had emerged - stagflation. Stagflation refers to a phenomenon where inflation is prominent, but growth is minimal. This is a dilemma for policy makers because usually a strong economy can handle higher benchmark interest rates designed to contain inflation. Growth and inflation usually go hand in hand since strong demand pushes up prices. However, if there’s inflation but not growth, we get the downside of rising prices but no upside of increasing productivity. This translates to decreased purchasing power for consumers, and a general challenge for the economy. This is evident in the below chart, which shows that the DJIA essentially stayed flat for a decade!
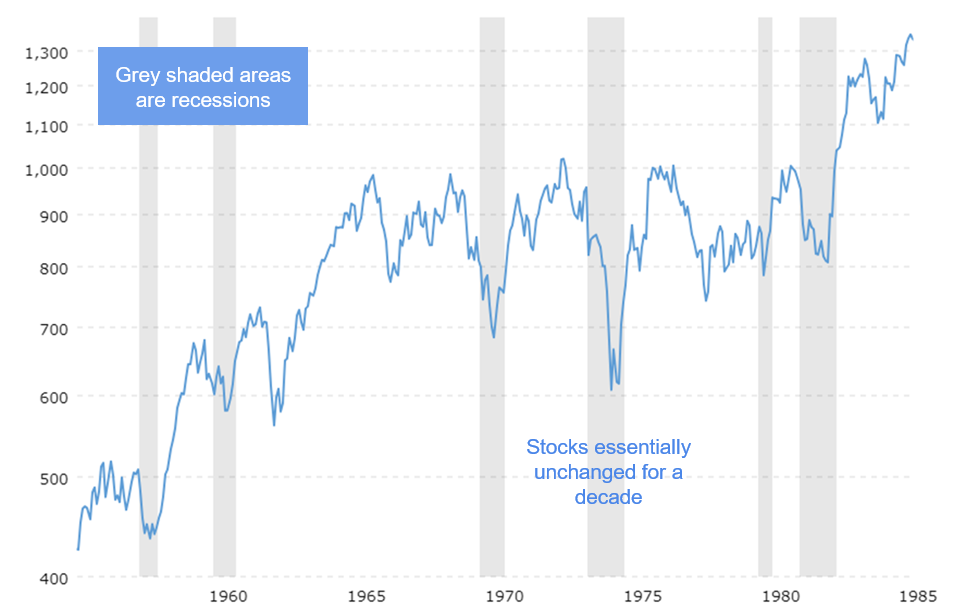
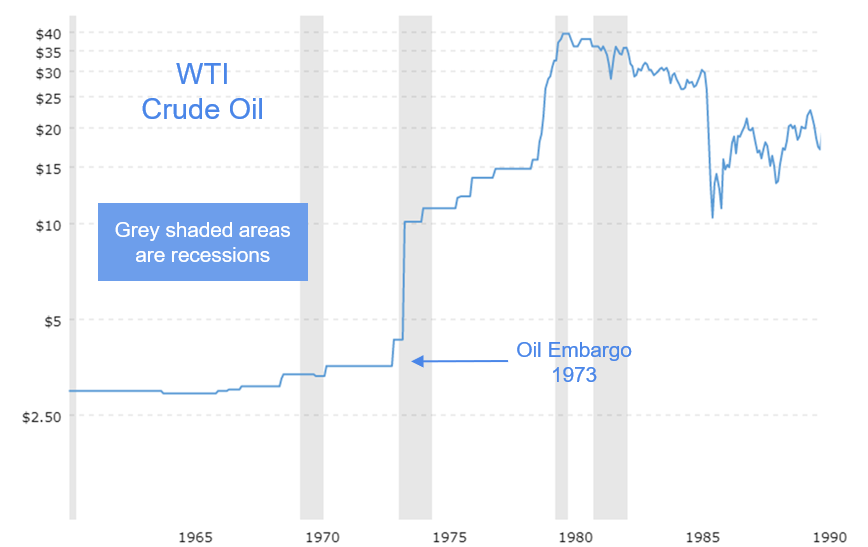
It was in this period that inflation expectations and the credibility of the Fed was put to the test. Oil prices rose due to a supply shock from events in the Middle East, and contributed heavily to inflation. A barrel of WTI crude rose from about $3.50 before the OPEC embargo in 1973 to over $35 by 1980, a ten-fold increase!
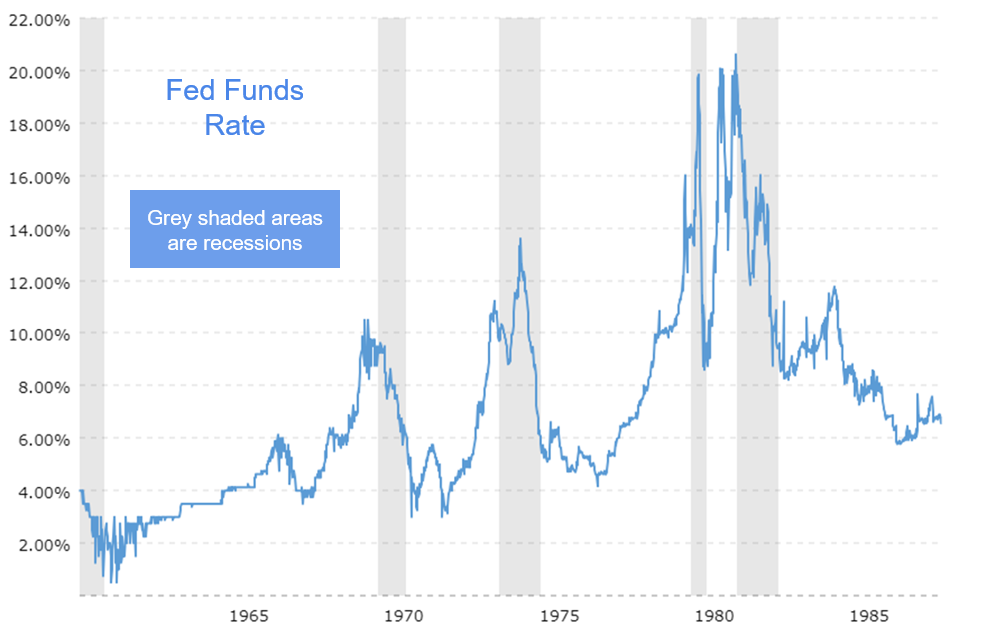
Because the Fed did not immediately take action to curtail inflation expectations, the market stopped believing in the effectiveness of the Fed in maintaining price stability. This eventually caused the Fed to raise rates to a level that might not have been needed had there been an immediate response to inflation risks. The double digit Fed funds rate pushed the economy into recession as borrowers struggled to pay their debt. But the restrictive monetary policy also eventually succeeded in getting inflation back under control, and paved the way for a booming decade in the 80s.
80s Boom
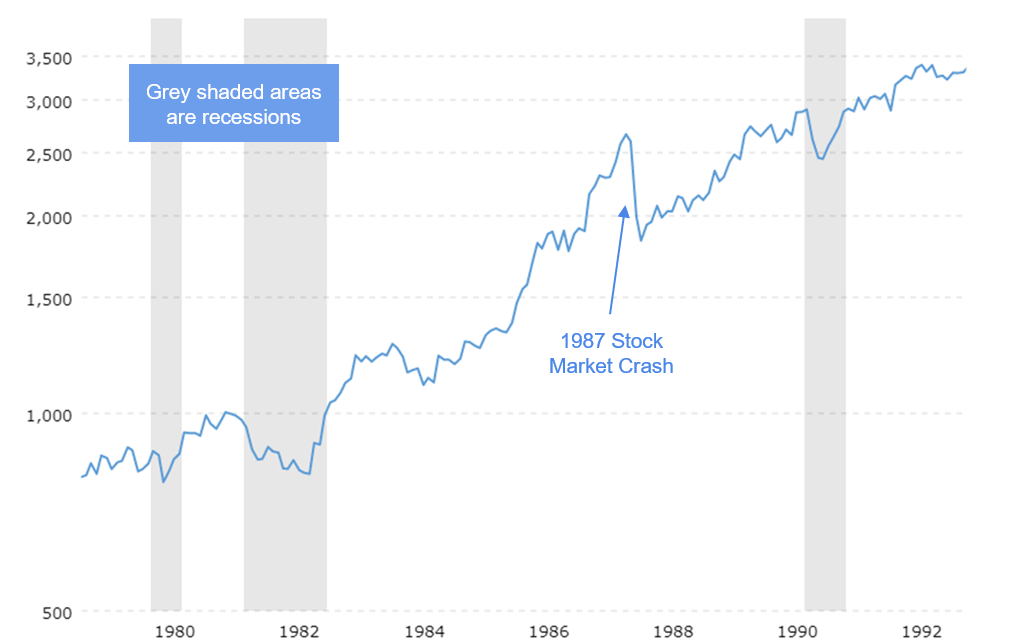
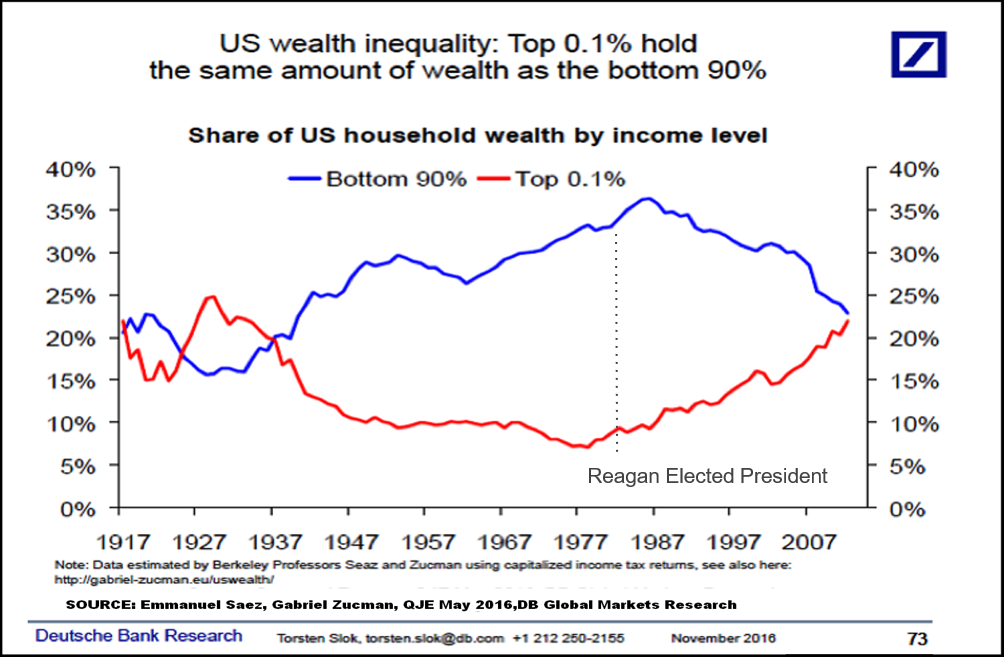
After a relatively discouraging decade for stocks in the 70s, the 80s bounced back with incredible strength. On the back of deregulation and tax cuts during the Reagan presidency, the DJIA soared from around 800 at the beginning of the decade to over 2500, more than triple its starting point.
While great for those invested in the market, the dazzling returns did not necessarily fall as favorably into the coffers of the average investor. Tax cuts mostly benefited wealthy individuals and corporations, while the breakup of unions weakened the average worker’s bargaining power in negotiating salaries. It is a decade of redistribution of wealth from the average American family to the owners of capital - shareholders.
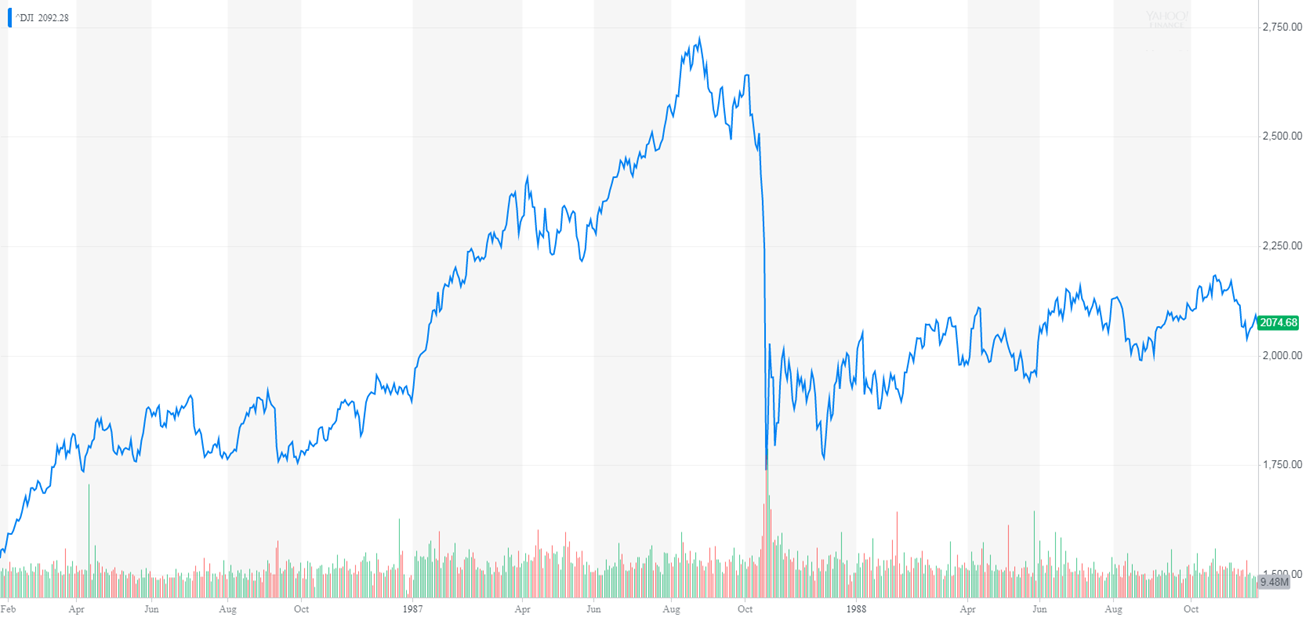
Besides broad systematic changes in our economy in the 80s, there was a market event that was quite extraordinary and insightful to study. Black Monday witnessed the largest percentage drop ever as the DJIA plunged 508 points, or 22.61% in one trading day. Many economists and traders suspect that it was due to the popularization of computer trading, which exacerbated losses as automatic selling based on certain triggers caused more automatic selling. Since then, stock exchanges have imposed circuit breakers to force the market to take a pause and calm down in times price drops past certain percentages. After all, since there was actually no recession, stocks were back to all time highs in just 2 years.
90s Tech Bubble
The 90s witnessed an amazing renaissance of technological innovations. It was the beginning of the internet age, and investors were keen to profit from it. However, as the decade progressed, expectations and enthusiasm was getting a little out of hand. Although nothing about the economy itself was doing badly, the danger was in the overconfidence in the internet stocks without regard for fundamentals. Alan Greenspan, chairman of the Fed from 1987 to 2006, coined the phrase irrational exuberance to describe the stock market at the time, Below is a chart of how stocks performed in the 90s.

To illustrate the extent of the mania, we will let the pooled knowledge of Wikipedia page “Dot-com bubble” to give us a few interesting things to consider:
- Between 1995 and 2000, the Nasdaq Composite stock market index rose 400%. It reached a price–earnings ratio of 200, dwarfing the peak price–earnings ratio of 80 for the Japanese Nikkei 225 during the Japanese asset price bubble of 1991.
- In 1999, shares of Qualcomm rose in value by 2,619%, 12 other large-cap stocks each rose over 1,000% value, and 7 additional large-cap stocks each rose over 900% in value.
- Even though the Nasdaq Composite rose 85.6% and the S&P 500 Index rose 19.5% in 1999, more stocks fell in value than rose in value as investors sold stocks in slower growing companies to invest in Internet stocks.
- An unprecedented amount of personal investing occurred during the boom and stories of people quitting their jobs to engage in full-time day trading were common.
- At the height of the boom, it was possible for a promising dot-com company to become a public company via an IPO and raise a substantial amount of money even if it had never made a profit—or, in some cases, realized any material revenue.
- In January 2000, there were 16 dot-com commercials during Super Bowl XXXIV, each costing $2 million for a 30-second spot.
2000s Financial Crisis
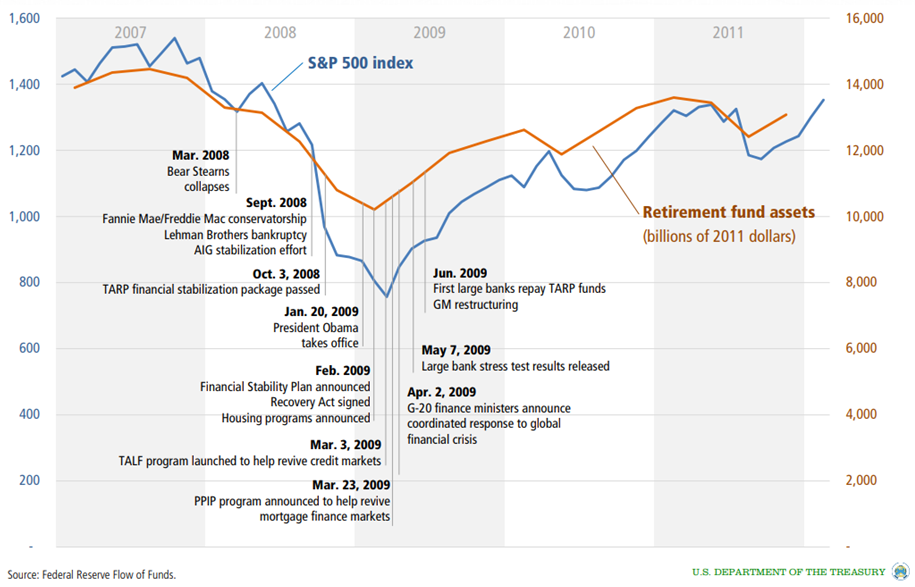
After a tumultuous start to the millennium, the U.S. economy was back on track and rolling with profits. The Bush tax cuts helped consumers and businesses regain confidence and a new bill in 2003 that made it easier for low-income applicants to buy homes. While a noble effort, this led to risky lending in the form of mortgages, and speculation by those who really couldn’t afford to.
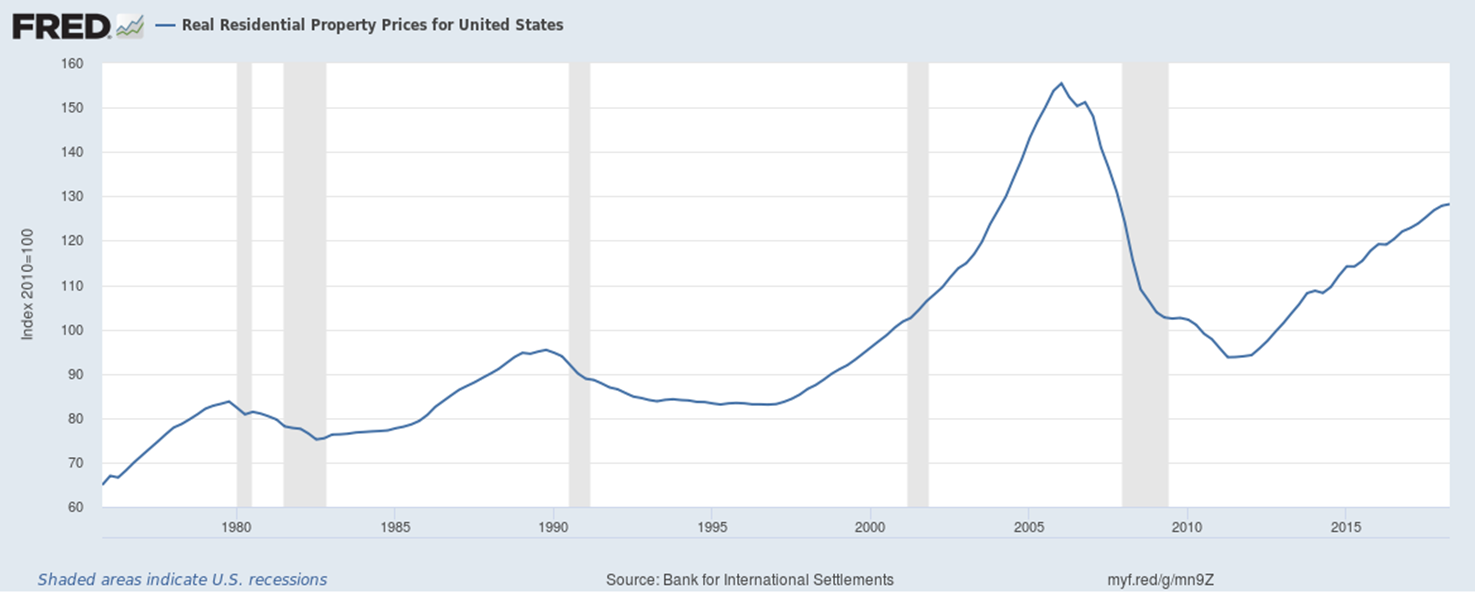
As home prices rose, homebuyers, investors, and banks kept on betting on prices to rise even more, taking an increasing amount of risk. When the prices actually started to roll over, homebuyers, investors, and many traders got caught holding assets that were worth less than initially thought. It was made worse by the fact that many of these investors and traders were using leverage - borrowed money that was not really theirs. In a fashion similar to the Great Depression, leverage made the recession worse than it otherwise would have been. We often place the blame on the financial sector for exacerbating risks, but the issue is always two-fold. Keep in mind that two major banks went bankrupt, forcing all of their employees out of work. Many other major banks saw their stocks fall more than 50%, and some still have not recovered to this day.
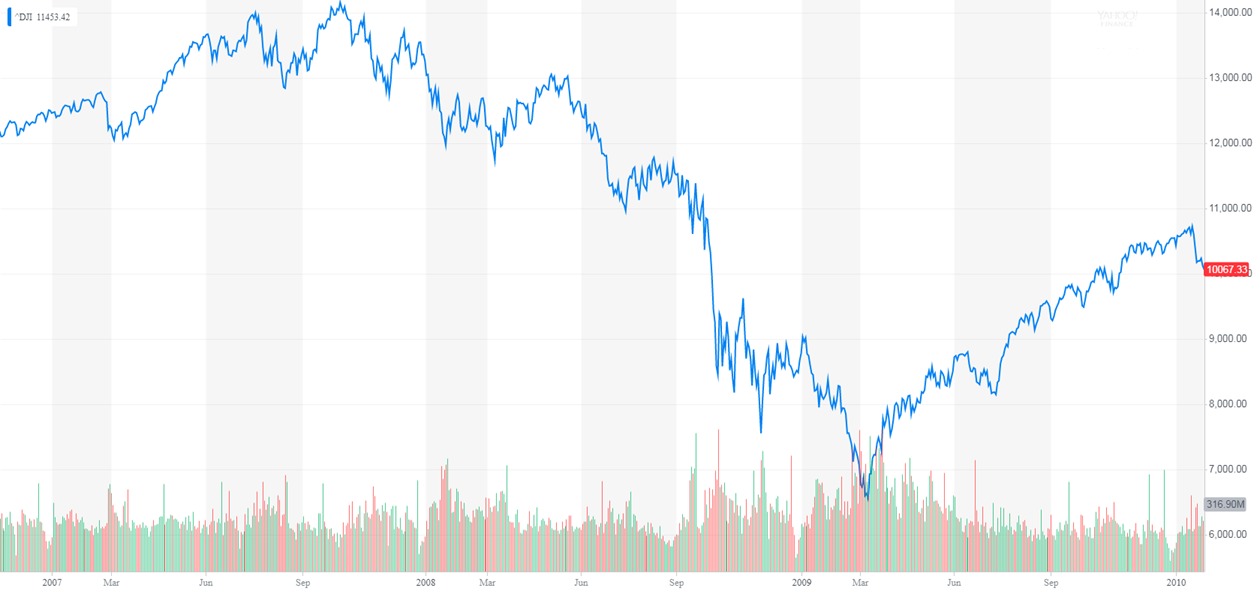
Thankfully, the government enacted dynamic policies the stabilize the financial system. They have drastically improved the state of the economy, and established the start of a slow, but steady recovery.
Modern Era Post Crisis
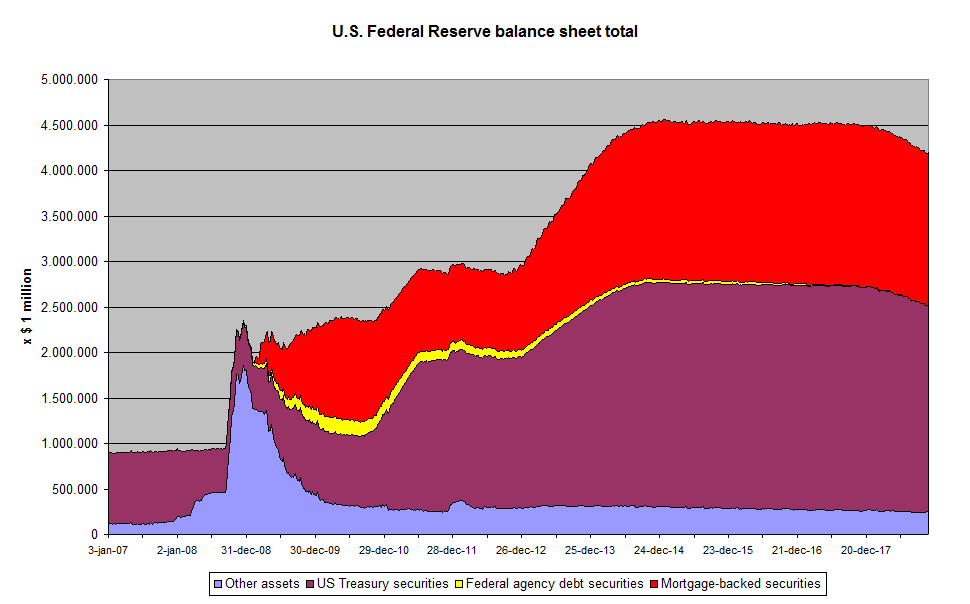
In the second decade of the 21st century, the U.S. economy has steadily recovered, but the stock market has made an more impressive run. This is partially due to the monetary policy of the Federal Reserve. In an attempt to stimulate the economy, the Fed put into action two plans to lower both short term and long term interest rates.
- Fed Funds Rate - on the short end, the Fed used the traditional monetary policy tool of lowering the Fed funds rate. This makes it easier for borrowers to access financing options in the short term.
- Quantitative Easing - on the long end, the Fed used a policy called quantitative easing to lower long term interest rates. It is done by purchasing long-maturity government securities to drive down yields and stimulate long term borrowing. The purchased securities are part of the Fed’s balance sheet, which has ballooned since the recession.
- The modern era has also witnessed the resurgence of technology companies as a vital part of the economy. In fact, several of the most valuable companies in the world are technology oriented companies like Apple, Microsoft, Amazon, and Alphabet (Google).
Review
Knowing the stock market’s history lets us look at present day developments in a different way. Being aware of past mistakes and patterns allow us to make better educated investment decisions in the future. If we can garner anything from looking at the past 100 years, it is perhaps that as long as we take care of our country, capitalism and innovation will work hand in hand to generate amazing investment returns for us. When we feel like our financial world collapsing, we should refer to this graph:
