Beta
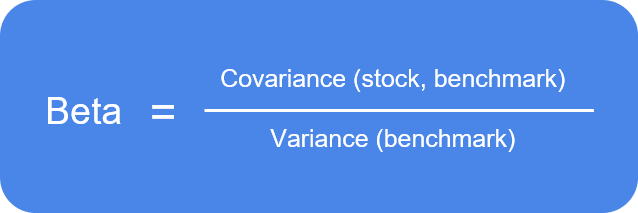
Stocks of individual companies have a statistical financial metric called beta that measures the stock’s correlation to the market and its volatility. The metric is calculated by the following equation:

Although beta can be extended to other asset classes, here we are mainly concerned with how it applies to single stocks. The calculation uses the covariance between a single stock and its benchmark market - in this case it would be the S&P 500. It then divides by the variance of the benchmark market to get a metric measuring:
- How correlated the stock is with the market - numerator
- How volatile the stock is compared to the market - denominator
This is a useful metric because when we assess the performance of a stock or portfolio, the raw percentage return does not give us the complete picture of how much risk we are taking. If one stock performs better than another stock in a bull market, it might not necessarily be that the company is so much better, but that the stock and company are naturally more volatile - outperforms in up markets, and underperforms in down markets. Beta helps us adjust for this volatility in returns.

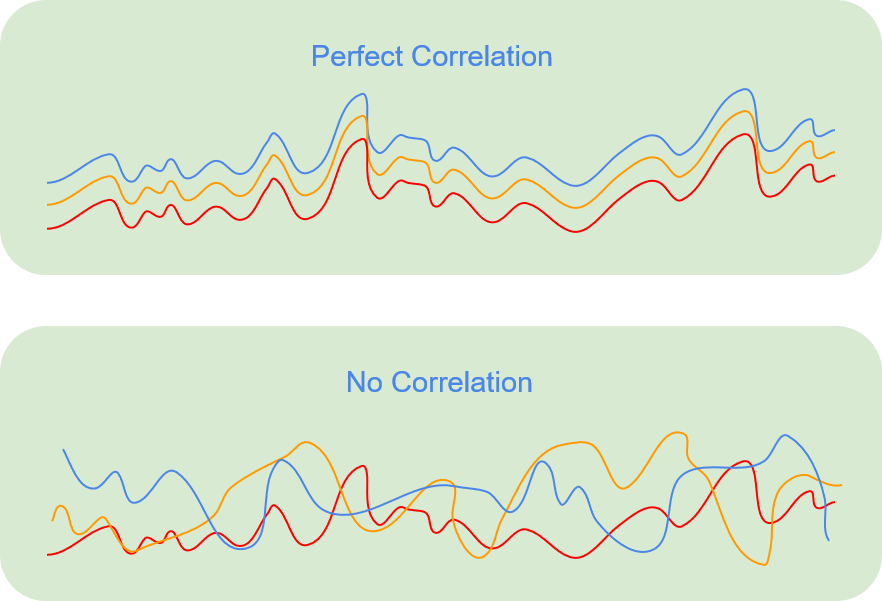
It also helps us determine how closely the stock moves with the general market - a measure of correlation. Does the stock rise and drop with the market? Or does it kind of do its own thing and trade rather independently of what the market does? This helps us choose stocks depending on how much market risk we want to take. This brings us to the discussion of the types of risks that we are taking:
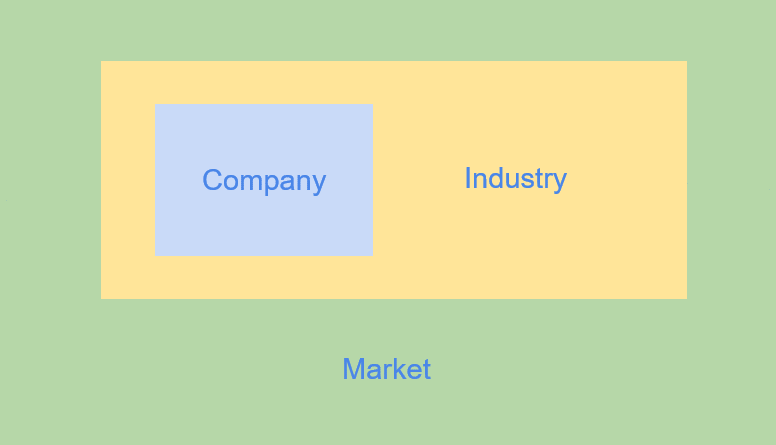
- Single Stock Risk - this can also be classified as idiosyncratic risk, news, events, earnings that affect a specific company or stock.
- Industry Risk - as opposed to exposure to single companies, this is the risk we are taking on when we invest in a certain sector. For example, if we invest in a healthcare stock, we are not only exposed to that company, but also the healthcare industry as a whole.
- Market Risk - finally, this can also be called systematic risk. Whenever we invest in stocks, we take on exposure to that specific company, the industry it is in, and the market in general. It is a type of risk that we cannot diversify away by investing in several companies, or several industries, because they are all part of the broader market. News and events like economic data and interest rate changes affect everyone exposed to systematic risk.
Passive Investing and Correlation
In an era of tug and pull between passive investing and active investing, a notable side effect of this dynamic is the degree of correlation of stocks with each other and the broader market. The proliferation of the ETF has made it easy for the average investor to invest in a diversified pool of stocks. But with this, also makes it easy to sell a pool of stocks quickly and all at once. Because of this ease of buying and selling baskets of stocks instead of individual stocks, the trading patterns of some stocks have over time become more correlated with how the general market trades. This is due to the fact that instead of many investors buying and selling the stock itself, it just gets bought and sold as part of the ETF. While passive investing increases ease of access for many investors, the downside is that when securities are bought and sold together, it limits the pricing accuracy of markets.

Impact on Active Investing
This phenomenon has in recent years impacted the performance of active fund managers. Active investors rely on choosing the best stocks that will outperform in both up and down markets. However, if everyone just trades ETFs, then stocks trade with high correlation to each other, and the opportunity to outperform diminishes. Thus, if the stocks picked by active managers trade no differently from other stocks, then passive investing seems more attractive because of their lower management fees. Of course, this also highly depends on the ability of active managers to pick the correct stocks, and great managers can really show their value over time.
Bull/Bear Correlation
Another situation in which stock correlations are affected is in times of fear. In bull markets, companies that do well often see their stocks rise more than companies that don’t do well. When panics occur, or in bear markets, fear takes over, and oftentimes there is forced selling. In situations like this, correlations tend to increase because investors just sell indiscriminately and try to get out of stocks in general. It is like a stampede that overwhelms, regardless of individual differences.

Because of a tendency for over-leveraged investors to be forced to sell in times of distress, stocks take a hit regardless of the quality of underlying companies. Of course owning a safe, stable company might help in the long run, but in the short run it’s a sea of red. To put this in an analogy, if we are climbing the wall of worry, some companies are better climbers than others. However if the wall itself is disintegrating, even the best climbers will have quite a bit of trouble. That said, this is an extreme example. A bear market does affect different stocks to varying degrees.
Growth vs. Value
In classifying types of stocks and companies, there are two categories that investors like to use:
- Growth - stocks of companies that are forecasted to grow in revenue and earnings at a rate above average. These companies often trade at higher P/E multiples that reflect these growth expectations.
- Value - stocks of companies that are forecasted to maintain healthy revenue and earnings for the price that they are trading at. These companies represent good deals in terms of the price that we are paying and what we get in return.
A common way of thinking goes like this - when times are good, growth companies outperform because they have potential to expand their revenues and earnings more so than value companies that are relatively mature and stable. However, when times are bad, value companies outperform because their business is more established. The high P/E multiples of growth companies signal higher prices, which also take larger hits in difficult times. While these are general patterns, always keep in mind that there are exceptions depending on the situation like company-specific factors.
Sectors and Cycles
While we have focused on single stocks compared to the entire market, each sector also performs performs differently under different environments. We can group some sectors into two categories - cyclical and countercyclical. Cyclical refers to the economic/business cycle - during expansions, cyclical companies tend to outperform because they are closely associated with economic growth. During contracts, countercyclical companies tend to outperform because they are either cycle-neutral, or their stocks actually benefit - comparatively - during a downturn. Of course not all sectors fit neatly into these two classifications, but it is a useful tool for analyzing some sectors.
Cyclical
Financials - Banks earn much of their profits from net-interest margins. Higher interest rates and steeper yield-curves are better for profitability, and they tend to occur in economic expansions. Other financials like credit-card processing companies are related to consumer spending and the volume of transactions, which tends to be higher in a good economy.

Industrials, Transportation, Energy - When the economy is booming, we transport more goods around, use more machinery in production, and consume more raw materials. Higher demand for transportation also relates to higher demand for fuel, boosting oil prices and the stocks of energy companies.


Consumer Discretionary - The consumer is a huge part of the economy, and if the economy is doing well, consumers will be in a better financial position to spend. Types of companies that might benefit include automobile, hotel/accommodations/travel, clothing/fashion retail, cinema, etc.

Countercyclical
Healthcare - Companies that provide medical services and products weather a downturn better than cyclical industries. This is because while we might spend less on entertainment and other leisure goods, we are less likely to forgo medical expenses that we need. A middle aged worker is not going to stop buying the medications he needs, but might take one less vacation per year.

Consumer Staples - When consumers are cash strapped, high end restaurants and entertainment companies might feel a decline in revenues. However, even when the economy is doing badly, consumers are not going to stop buying toothpaste, toilet paper, pots and pans, etc. Some fast food chains or lower-priced restaurants might actually see an increase in revenue due to higher traffic.

Utilities - Whether the economy is doing well or doing badly, people are still going to use water and electricity. There’s no going around the essentials of life. Utility stocks therefore weather an economic downturn better than stocks of cyclical companies.

Review
When we investing in companies, we are not just making a bet on that company. By association, we are effectively also making a bet on that company’s industry, and the stock market as a whole. Because of this, we might or might not want to mitigate certain risks. If we want to mitigate idiosyncratic risk, we might invest in a pool of companies in the same industry. If we want to mitigate industry risk, we might want to invest in a pool of companies across different industries. A way of measuring the amount of correlation our investments have with the market is called beta. Knowing our investments’ beta is important in assessing the amount and type of risk that we are taking.